SystemTap
17 Feb 2017SystemTap是一个简化收集linux运行系统信息的框架和工具,可以用于查找功能问题和分析性能瓶颈。
入门
- 安装systemtap
# yum install systemtap systemtap-runtime
- 安装依赖
# stap-prep主要是内核调试包,包括:kernel-debuginfo, kernel-debuginfo-common, kernel-devel。 如果自己编译内核,需要的内核配置项包括:
CONFIG_DEBUG_INFO CONFIG_KPROBES CONFIG_DEBUG_FS CONFIG_RELAY - 测试
$ sudo stap -ve 'probe begin { log("hello world") exit() }'
Pass 1: parsed user script and 118 library scripts using 108980virt/40976res/6524shr/34664data kb, in 90usr/0sys/125real ms.
Pass 2: analyzed script: 1 probe, 2 functions, 0 embeds, 0 globals using 109772virt/41948res/6716shr/35456data kb, in 0usr/0sys/3real ms.
Pass 3: translated to C into "/tmp/stapsaeAg6/stap_f71c690ac6aa6ac5b2fbf755fac45355_1089_src.c" using 109772virt/42748res/7288shr/35456data kb, in 0usr/0sys/0real ms.
Pass 4: compiled C into "stap_f71c690ac6aa6ac5b2fbf755fac45355_1089.ko" in 7520usr/620sys/10964real ms.
Pass 5: starting run.
hello world
Pass 5: run completed in 0usr/20sys/480real ms.
运行时的内核release和version(包括编译时间)必须与系统目录下的内核文件一致。
原理
内核引入了一种Kprobe机制,可以用来动态地收集调试和性能信息的工具,是一种非破坏性的工具,用户可以用它跟踪运行中内核任何函数或执行的指令等。但Kprobe并没有提供一种易用的框架,用户需要自己去写模块,然后安装。SystemTap 是利用Kprobe 提供的API来实现动态地监控和跟踪运行中的Linux内核的工具,相比Kprobe,systemtap更加简单,提供给用户简单的命令行接口,以及编写内核指令的脚本语言。SystemTap也支持用户态程序调试。
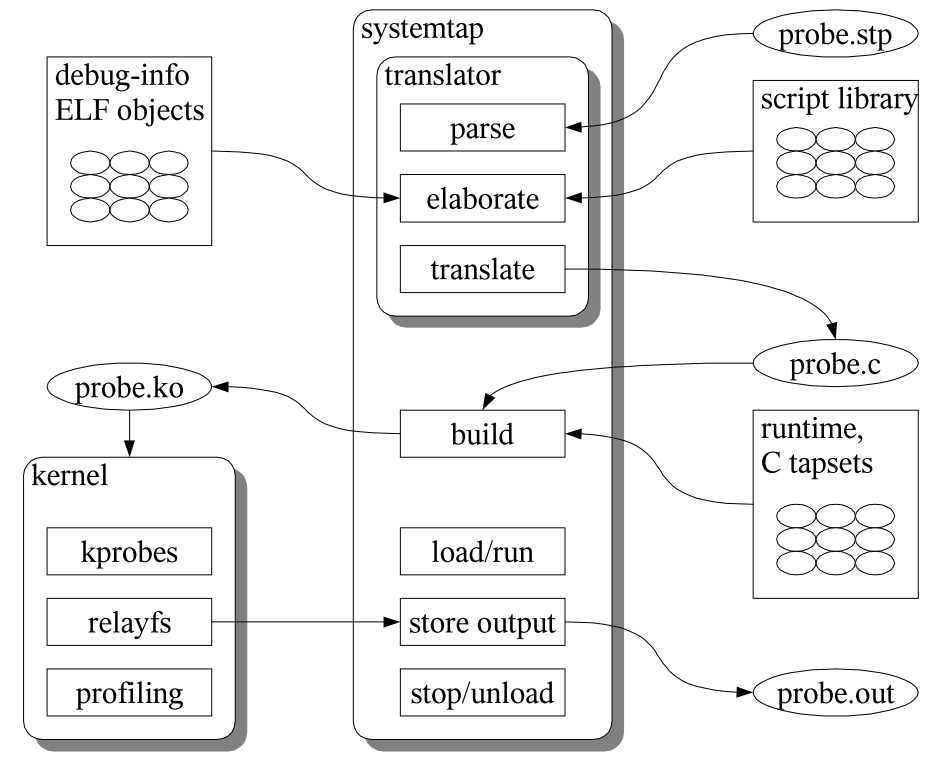
架构
SystemTap会话
- SystemTap根据现有的tapset(/usr/share/systemtap/tapset/)检查probe脚本是否使用tapsets。如果使用,根据库的定义替换相应的tapset。
- 将脚本转换成C,编译器编译成内核模块。
- 加载内核模块,启用脚本中的probes(事件和处理方法)。
- 事件发生时,执行处理函数。
- 会话结束时,禁用probes,卸载内核模块。
命令
- stap,从systemtap脚本读probe指令,并转换成C代码,编译成内核模块并加载。
- staprun,运行systemtap脚本生成的内核模块
事件
- 同步事件
- syscall.system_call
- vfs.file_operation
- kernel.function(“function”)
- kernel.trace(“tracepoint”),静态probe,如kernel.trace(“kfree_skb”)
- module(“module”).function(“function”)
- 异步事件,不是特定的指令或代码,包括计数器、定时器等。
脚本
SystemTap脚本的核心想法是命名事件,然后增加处理函数。事件发生时内核调用处理函数,然后恢复执行。事件种类包括函数进入和退出,定时器超时,systemtap会话启动和停止。处理函数是一系列脚本语言声明指定事件发生时要做的事情。一般包括从事件上下文中提取数据、保存到内部变量或者打印结果。 SystemTap脚本由事件和处理方法两部分组成:
probe event {statements}
函数
function function_name(arguments) {statements}
probe event {function_name(arguments)}
Tracing
最简单的probe是trace事件,即在程序中加入print。
- 脚本
# cat strace-open.stp probe syscall.open { printf ("%s(%d) open (%s)\n", execname(), pid(), argstr) } probe timer.ms(4000) # after 4 seconds { exit () } - 执行结果
# stap strace-open.stp
vmware-guestd(2206) open ("/etc/redhat-release", O_RDONLY)
hald(2360) open ("/dev/hdc", O_RDONLY|O_EXCL|O_NONBLOCK)
hald(2360) open ("/dev/hdc", O_RDONLY|O_EXCL|O_NONBLOCK)
hald(2360) open ("/dev/hdc", O_RDONLY|O_EXCL|O_NONBLOCK)
df(3433) open ("/etc/ld.so.cache", O_RDONLY)
df(3433) open ("/lib/tls/libc.so.6", O_RDONLY)
df(3433) open ("/etc/mtab", O_RDONLY)
hald(2360) open ("/dev/hdc", O_RDONLY|O_EXCL|O_NONBLOCK)
probe位置
事件命名规则:
- begin,会话开始
- end,会话结束
- kernel.function(“sys_open”),内核中sys_open函数入口
- syscall.close.return,close系统调用的返回
- module(“ext3”).statement(0xdeadbeef),ext3文件系统驱动模块特定地址位置的指令
- timer.ms(200),定时器每200毫秒触发一次
- timer.profile,定时器在每个CPU上定时触发
- perf.hw.cache_misses,特定数量的cache失效发生
- procfs(“status”).read,进程读procfs文件
- process(“a.out”).statement(“*@main.c:200”),a.out程序的第200行
通配符
内核net/socket.c文件中的所有函数
kernel.function("*@net/socket.c")
打印内容
- tid(),当前线程id
- pid(),当前线程的进程id
- uid(),当前用户id
- execname(),当前进程名称
- cpu(),当前cpu编号
- gettimeofday_s(),自从epoch的秒数
- get_cycles(),硬件cycle计数器的快照
- pp(),当前处理的probe point描述信息
- ppfunc(),这个probe所存放的文件名(如果知道) -\(vars,列出所有本地变量(\)locals),参数(\(parms)和返回值(\)return)
- print_backtrace(),打印内核backtrace
- print_ubacktrace(),打印用户空间backtrace
- thread_indent(),打印timestamp(第一次调用开始的微秒数)、进程名和进程ID
分析
控制语句
| 语句 | 说明 |
|---|---|
| if (exp) {} else {} | 标准的 if-then-else 语句 |
| for (exp1 ; exp2 ; exp3 ) {} | 一个 for 循环 |
| while (exp) {} | 标准的 while 循环 |
| do {} while (exp) | 一个 do-while 循环 |
| break | 退出迭代 |
| continue | 继续迭代 |
| next | 从探针返回 |
| return | 从函数返回一个表达式 |
| foreach (VAR in ARRAY) {} | 迭代一个数组,将当前的键分配给 VAR |
表达式
- 比较,>,==
- 赋值,=
- 字符串连接使用".",如(”hello” . “ “ . “world”)
目标变量
- &,取地址
- $,打印结构体
- @,投射指针的类型
- @defined(),检查是否存在
- $1,$2,命令行参数
函数
function function_name(arguments) {statements}
probe event {function_name(arguments)}
数组
array_name[index_expression]
数组中的元素可以是多个值:
device[pid(),execname(),uid(),ppid(),"W"] = devname
操作:
- delete,删除某个元素或整个数组
注:所有数组必须全局声明(global)。
聚集
聚集(aggregates)是字符串和数字之外的第三种值,用于统计多个值,使用“«<”运算符想聚集中增加值。 操作包括基本的@min、@max、@count、@avg 和 @sum,还可以使用@hist_log 和 @hist_linear。
- print(@hist_linear(a,0,100,10))
- print(@hist_log(writes[“zsh”]))
Tapsets
别名
probe别名是从现有的probe points创建新的更上层抽象。probe别名定义:
probe <alias> = <probepoint> { <prologue_stmts> }
probe <alias> += <probepoint> { <epilogue_stmts> }
别名定义后并不执行,需要脚本额外调用。
probe别名使用场景
- if ($flag1 != $flag2) next,在特定条件下才probe
- name = “foo”,提供描述名
- var = $var,将目标变量转成本地变量
示例
- 脚本
# cat probe-alias.stp probe syscallgroup.io = syscall.open, syscall.close, syscall.read, syscall.write { groupname = "io" } probe syscallgroup.process = syscall.fork, syscall.execve { groupname = "process" } probe syscallgroup.* { groups [execname() . "/" . groupname] ++ } probe end { foreach (eg+ in groups) printf ("%s: %d\n", eg, groups[eg]) } global groups - 运行结果
# stap probe-alias.stp
05-wait_for_sys/io: 19
10-udev.hotplug/io: 17
20-hal.hotplug/io: 12
X/io: 73
apcsmart/io: 59
[...]
make/io: 515
make/process: 16
[...]
xfce-mcs-manage/io: 3
xfdesktop/io: 5
[...]
xmms/io: 7070
zsh/io: 78
zsh/process: 5
# cat timer_test.stp
#!/usr/bin/stap
probe timer_alias = timer.s(3) {printf("Entering timer\n")}
probe timer_alias += timer.s(3) {printf("Leaving timer\n")}
probe timer_alias {printf("In timer \n")}
# ./timer_test.stp
Entering timer
In timer
In timer
Leaving timer
......
嵌入C
有些值不能从普通目标变量($var)中获取,如复杂结构体中的成员、多层宏定义等。在特定上下文中可以在tapset中嵌入C代码,用户脚本如果嵌入C代码需要在运行时增加‘-g’选项(guru模式)。 脚本中的C代码需要用%{和%}包含,参数和返回值使用宏STAP_ARG_* 和 STAP_RETVALUE。 使用:string,:long后缀标识类型。
# cat embedded-C.stp
%{
#include <linux/sched.h>
#include <linux/list.h>
%}
function task_execname_by_pid:string (pid:long) %{
struct task_struct *p;
struct list_head *_p, *_n;
list_for_each_safe(_p, _n, ¤t->tasks) {
p = list_entry(_p, struct task_struct, tasks);
if (p->pid == (int)STAP_ARG_pid) // 参数
snprintf(STAP_RETVALUE, MAXSTRINGLEN, "%s", p->comm); // 返回值
}
%}
probe begin
{
printf("%s(%d)\n", task_execname_by_pid(target()), target())
exit()
}
# pgrep emacs
16641
# stap -g embedded-C.stp -x 16641
emacs(16641)
用户空间
内核需要支持uprobes。
CONFIG_UPROBES=y
用户空间事件
所有用户空间事件probe以process开头,也可以额外指定进程ID。
- process(“PATH”).function(“function”)
- process(“PATH”).statement(“statement”),对应内核的kernel.statement(“statement”)
- process(“PATH”).mark(“marker”),静态probe point
- process.begin,用户进程创建
- process.thread.begin,用户线程创建
- process.end
- process.thread.end
- process.syscall,进程产生系统调用
- ubacktrace()
- print_usyms(ubacktrace()),打印用户态调用栈
使用方法
- 命令行执行
# stap script.stap -c "command params" - 现有进程
# stap script.stap -x pid
参考
Systemtap tutorial SystemTap Beginners Guide Linux 自检和 SystemTap SystemTap: Instrumenting the Linux Kernel for Analyzing Performance and Functional Problems
附录
systemtap调试qemu
-
下载qemu代码
-
编译,启用dtrace作为trace后端
qemu# ./configure --enable-trace-backend=dtrace --enable-debug --enable-kvm --enable-spice --enable-usb-redir --target-list=x86_64-softmmu
qemu# make -j8
[...]
  GEN     x86_64-softmmu/qemu-system-x86_64.stp-installed
  GEN     x86_64-softmmu/qemu-system-x86_64.stp
  GEN     x86_64-softmmu/qemu-system-x86_64-simpletrace.stp
  CC      x86_64-softmmu/trace/generated-helpers.o
  LINK    x86_64-softmmu/qemu-system-x86_64
其中qemu-system-x86_64.stp和qemu-system-x86_64-simpletrace.stp是tracetool.py生成的qemu trace事件的systemtap脚本库。也可以自己生成:
qemu# scripts/tracetool.py --backends=dtrace --format=stap \
                         --binary /usr/libexec/qemu-system-x86_64 \
                         --target-type system \
                         --target-name x86_64 \
                         <trace-events >qemu.stp
tracetool.py将qemu预定义的静态probe points转成systemtap脚本,但只有别名,没有启用任何probe point。命令中参数–format=stap可以换成–format=simpletrace-stap。simpletrace-stap依赖于stap:
# head qemu-system-x86_64.stp
probe qemu.kvm.qemu_memalign = process("/usr/libexec/qemu-kvm").mark("qemu_memalign")
{
  alignment = $arg1;
  size = $arg2;
  ptr = $arg3;
}
probe qemu.kvm.qemu_anon_ram_alloc = process("/usr/libexec/qemu-kvm").mark("qemu_anon_ram_alloc")
{
  size = $arg1;
  ptr = $arg2;
}
# head qemu-system-x86_64-simpletrace.stp
probe qemu.kvm.simpletrace.qemu_memalign = qemu.kvm.qemu_memalign ?
{
    printf("%8b%8b%4b%4b%8b%8b%8b", 0, gettimeofday_ns(), 24 + 8 + 8 + 8, pid(), alignment, size, ptr)
}
probe qemu.kvm.simpletrace.qemu_anon_ram_alloc = qemu.kvm.qemu_anon_ram_alloc ?
{
    printf("%8b%8b%4b%4b%8b%8b", 1, gettimeofday_ns(), 24 + 8 + 8, pid(), size, ptr)
}
- 测试脚本
# cat usb.stp #!/usr/bin/env stap probe qemu.system.x86_64.simpletrace.usb_xhci_reset {} probe qemu.system.x86_64.simpletrace.usb_xhci_run {} probe qemu.system.x86_64.simpletrace.usb_xhci_stop {} probe qemu.system.x86_64.simpletrace.usb_xhci_exit {} - 执行脚本
stap -o usb-test.log -v usb.stp -c "/usr/bin/qemu-system-x86_64 -machine pc,accel=kvm,usb=off -cpu host -m 2048 -hda /root/win10-2.qcow2 -device nec-usb-xhci,id=xhci -chardev spicevmc,id=charredir0,name=usbredir -device usb-redir,chardev=charredir0,id=redir0,bus=xhci.0 -vnc 0.0.0.0:2 -spice port=5911,disable-ticketing -device usb-tablet,id=input0" Pass 1: parsed user script and 119 library script(s) using 257952virt/75272res/3136shr/72768data kb, in 510usr/30sys/538real ms. Pass 2: analyzed script: 3 probe(s), 7 function(s), 4 embed(s), 2 global(s) using 275092virt/93556res/4296shr/89908data kb, in 300usr/80sys/385real ms. Pass 3: translated to C into "/tmp/stapvBXCrF/stap_84f55616562a9cdcac24201d7a9a00d4_6000_src.c" using 275092virt/93960res/4628shr/89908data kb, in 250usr/70sys/396real ms. Pass 4: compiled C into "stap_84f55616562a9cdcac24201d7a9a00d4_6000.ko" in 5600usr/640sys/5713real ms. Pass 5: starting run. - 查看结果
# /usr/share/qemu-kvm/simpletrace.py --no-header /usr/share/qemu-kvm/trace-events usb-test.log
usb_xhci_reset 0.000 pid=12385
usb_xhci_reset 100115.620 pid=12385
usb_xhci_run 199.909 pid=12385
usb_xhci_stop 122026.364 pid=12385
usb_xhci_reset 21487900.225 pid=12385
usb_xhci_run 6972.546 pid=12385
usb_xhci_stop 520594087.978 pid=12385