blktrace
使用blktrace跟踪系统IO路径,分析存储性能瓶颈。
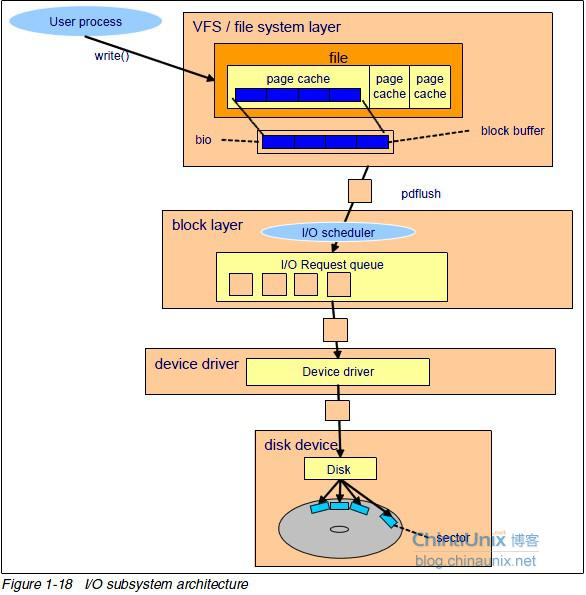
IO从文件系统到设备在Linux中的数据流:
blktrace是一个块设备层IOtracing机制,为用户空间提供请求队列操作的详细信息。主要包括3部分:
- 内核,内核事件日志接口和
- blktrace,将内核事件trace转成
- blkparse,格式化事件信息并存储到文件
- blkiomon,基于blktrace数据监控块设备IO,定时生成统计信息
准备
- 安装blktrace工具
# yum install blktrace
- 挂载debugfs
# mount -t debugfs debugfs /sys/kernel/debug
使用
- 在线trace
# blktrace -d /dev/sda -o - | blkparse -i -
  8,0    3        1     0.000000000   697  G   W 223490 + 8 [kjournald]
  8,0    3        2     0.000001829   697  P   R [kjournald]
  8,0    3        3     0.000002197   697  Q   W 223490 + 8 [kjournald]
  8,0    3        4     0.000005533   697  M   W 223498 + 8 [kjournald]
  8,0    1       11     0.009507758     0  C   W 223490 + 56 [0]
  8,0    1       12     0.009538995   697  G   W 223546 + 8 [kjournald]
  8,0    1       13     0.009540033   697  P   R [kjournald]
  8,0    1       14     0.009540313   697  Q   W 223546 + 8 [kjournald]
  8,0    1       15     0.009542980   697  D   W 223546 + 8 [kjournald]
  8,0    1       16     0.013542170     0  C   W 223546 + 8 [0]
...
^C
...
CPU1 (8,0):
 Reads Queued:           0,        0KiB  Writes Queued:           7,      128KiB
 Read Dispatches:        0,        0KiB  Write Dispatches:        7,      128KiB
 Reads Completed:        0,        0KiB  Writes Completed:       11,      168KiB
 Read Merges:            0               Write Merges:           25
 Read depth:             0        	 Write depth:             9
 IO unplugs:             0               Timer unplugs:           0
...
CPU3 (8,0):
 Reads Queued:           0,        0KiB  Writes Queued:           1,       28KiB
 Read Dispatches:        0,        0KiB  Write Dispatches:        1,       28KiB
 Reads Completed:        0,        0KiB  Writes Completed:        0,        0KiB
 Read Merges:            0               Write Merges:            6
 Read depth:             0        	 Write depth:             9
 IO unplugs:             0               Timer unplugs:           0
Total (8,0):
 Reads Queued:           0,        0KiB  Writes Queued:          11,      168KiB
 Read Dispatches:        0,        0KiB  Write Dispatches:       11,      168KiB
 Reads Completed:        0,        0KiB  Writes Completed:       11,      168KiB
 Read Merges:            0               Write Merges:           31
 Read depth:             0        	 Write depth:             9
 IO unplugs:             0               Timer unplugs:           3
Throughput (R/W): 0KiB/s / 832KiB/s
Events (8,0): 1,152 entries
Events (8,0): 89 entries, 0 skips
btrace脚本可以简化在线tracing设备,上面的命令也可以用下面的命令实现:
# btrace /dev/sda
# blktrace /dev/sda /dev/sdb
# blkparse sda sdb
blktrace
命令参数
| 短格式 | 长格式 | 描述 |
|---|---|---|
| -A hex-mask | -set-mask=hex-mask | filter mask设置为ex-mask |
| -a mask | -act-mask=mask | 当前filter增加mask |
| -b size | -buffer-size=size | 指定事件缓冲区大小(KB) |
| -d dev | -dev=dev | 添加dev作为trace的设备 |
| -I devs file | -input-devs=devs file | 添加文件中的设备进行trace(每个设备一行) |
| -k | -kill | 杀掉正在运行的trace |
| -n num-sub | -num-sub=num-sub | 使用的缓冲区数量 |
| -l | –listen | 网络监听模式(blktrace server) |
| -h hostname | –host=hostname | 网络客户端模式,连接给定的host |
| -p number | –port=number | 使用的网络端口,默认8462 |
| -s | –no-sendfile | 客户端不使用sendfile()传输数据 |
| -o basename | -output=basename | 输出文件名,默认device.blktrace.cpu |
| -D dir | –output-dir=dir | 加到输出文件之前 |
| -r rel-path | -relay=rel-path | 指定debugfs的挂载点 |
| -V | -version | 版本 |
| -w seconds | -stopwatch=seconds | 运行时间 |
Filter Mask
- barrier
- complete
- fs,文件系统请求
- issue
- pc,设备请求
- queue
- read
- requeue
- sync
- write
- notify,trace信息
- drv_data,
请求类型
- 文件系统,fs请求
- SCSI命令,pc请求
blkparse
合并不同CPUs上不同设备的流,产生格式化的事件信息。
命令参数
| 短格式 | 长格式 | 描述 |
|---|---|---|
| -b batch | -batch=batch | Standard input read batching |
| -i file | -input=file | Specifies base name for input files - default is device.blktrace.cpu. As noted above, specifying -i - runs in live mode with blktrace (reading data from standard in). |
| -F typ,fmt | -format=typ,fmt | Sets output format |
| -f fmt | -format-spec=fmt | (See section 4.3 for details.) The -f form specifies a format for all events The -F form allows one to specify a format for a specific event type. The single-character typ field is one of the action specifiers in section 4.3.2 |
| -m | -missing | Print missing entries |
| -h | -hash-by-name | Hash processes by name, not by PID |
| -o file | -output=file | Output file |
| -O | -no-text-output | Do not produce text output, used for binary (-d) only |
| -d file | -dump-binary=file | Binary output file |
| -q | -quiet | Quite mode |
| -s | -per-program-stats | Displays data sorted by program |
| -t | -track-ios | Display time deltas per IO |
| -w span | -stopwatch=span | Display traces for the span specified - where span can be: end-time - Display traces from time 0 through end-time (in ns) or start:end-time - Display traces from time start through end-time (in ns). |
| -v | -verbose | More verbose marginal on marginal errors |
| -V | -version | Display version |
blkiomon
命令格式
blkiomon -I interval [ -h file ] [ -b file ] [ -d file ] [ -D file ] [ -Q path_name -q msg_queue_id -m msg_id ] [ -V ]
示例
% blktrace /dev/sdw -a issue -a complete -w 3600 -o - | blkiomon -I 10 -h -
Trace Actions
| 短格式 | 长格式 | 描述 |
|---|---|---|
| C | complete | 之前发出的请求完成情况,输出包含请求sector和大小,成功或失败 |
| D | issued | 存在block layer queue或io scheduler的请求发到驱动 |
| I | inserted | 从scheduler到内部queue的请求,后面被驱动使用 |
| Q | queued | 在特定位置的queue io |
| B | bounced | bio的数据页不能被硬件访问,需要拷贝到lower内存,会影响性能 |
| M | back merge | 结束边界,scheduler可以合并 |
| F | front merge | 开始边界 |
| G | get request | 发送任何请求到块设备,需要先分配请求结构体 |
| S | sleep | 没有可用的请求结构体,需要等待释放 |
| P | plug | io在之前空的设备队列上,数据在需要之前plug |
| U | unplug | 一些请求数据已经在设备的队列上,开始发送请求到驱动。如果超时或一定数量的请求加入队列,自动unplug |
| T | unplug due to timer | 如果plugging到队列的io请求没人处理,一段时间后自动unplug |
| X | split | raid或device mapper设置时,incoming io可能跨越设备或内部zone,需要切成更小的块。会引起性能问题 |
| A | remap | stacked设备incoming io映射到下面的设备 |
输出描述和格式化
| 字段 | 描述 |
|---|---|
| a | Action,对应Trace Action |
| c | CPU id |
| C | Command |
| d | RWBS,1-3个字符,Read/Write/Barrier/Synchronous |
| D | 7个字符,包含事件设备的主、次设备号 |
| e | 错误码 |
| m | 次设备号 |
| M | 主设备号 |
| n | 块数量 |
| N | 字节数 |
| p | 进场ID |
| P | 显示包数据 |
| s | Sequence number |
| S | Sector number |
| t | 时间戳,纳秒 |
| T | 时间戳,秒 |
| u | 微妙 |
| U | 整形负载 |
用户可以指定字段显示宽度、左对齐(-)。如指定命令按12字符左对齐:
-f "%-12C"
默认输出
"%D %2c %8s %5T.%9t %5p %2a %3d "
major,minor cpu seq second.nano-second pid action rwbs